Turn your raw data into a publication-ready manuscript.
Kings Analytics helps doctors, residents and researchers design studies, analyse data and write results that get accepted — led by a published physician-biostatistician who has supported 100+ research projects and authored work in international journals.
SPSS · R · Stata · REDCap
Study design → analysis → visualisation → medical writing → submission

Ojeh-Oziegbe
MBBS · Physician-biostatistician
MBBS · Physician-biostatistician · Founder
A complete research pipeline, one point of contact
Come with a dataset that hasn't been touched, a half-written manuscript, or just a research question. I take it the rest of the way.
Study design & proposals
Research questions, objectives, sample-size calculation, and a statistical analysis plan that survives peer review and ethics committees.
Data cleaning & management
Messy spreadsheets, REDCap and questionnaire exports turned into a clean, coded, analysis-ready dataset — with an audit trail.
Statistical analysis (SPSS/R/Stata)
Descriptive and inferential statistics, chi-square, t-tests, ANOVA, correlation, and multivariable regression in SPSS, R or Stata.
Data visualisation
Journal-quality tables, charts and forest plots — figures formatted to your target journal's requirements.
Medical writing
Methods and results sections written in clean academic English, plus discussion support and verified, correctly-styled references.
Submission & revisions
Formatting to journal guidelines, cover letters, and point-by-point responses to reviewers — support until your manuscript is accepted.
Simple, transparent, built around your deadline
You always know what's happening and what it costs before any work begins.
Free consult
A 30-minute call or chat to understand your data, your goal, and your deadline.
Fixed quote
A clear scope and price up front. 50% to start, 50% on delivery. No surprises.
Analysis & drafting
I clean, analyse and write — sharing outputs as I go so you're never in the dark.
Delivery & revision
Formatted tables, figures and write-up, with revisions included and reviewer support after.
Real projects, real results
A sample of analyses taken from raw data to a completed, defensible output. Client and participant details are kept strictly confidential.
Spirometry knowledge & practice among 210 clinicians

Figure from this study — spirometry KAP survey of 210 clinicians (published, Ibom Medical Journal, 2026).
Challenge: A multi-centre KAP survey of 210 healthcare professionals across four hospital tiers needed to move from raw questionnaire data to a journal submission.
What I did: Built composite knowledge, attitude and practice scores; ran chi-square and Mann–Whitney tests; fitted a binary logistic regression to isolate independent predictors; produced all tables and a forest plot in SPSS v27; wrote the methods and results.
Cardiometabolic risk in a hypertensive cohort
Challenge: Hospital records on hypertensive patients needed to become several publishable papers on dyslipidaemia, cholesterol predictors and clustering of cardiometabolic risk.
What I did: Cleaned the dataset, ran prevalence estimates, cross-tabulations and multivariable regression to identify sociodemographic and clinical predictors, and wrote journal-formatted methods, tables and results across multiple manuscripts.
Depression among 303 elderly rural residents

Figure from this study — geriatric depression survey of 303 rural residents (GDS-15 screening).
Challenge: An MBBS dissertation team had GDS-15 survey data from 303 older adults but no analysis plan or results chapter.
What I did: Scored the GDS-15, estimated prevalence and severity, ran univariate then multivariable logistic regression for risk factors, and generated 10 formatted tables plus a forest plot of adjusted odds ratios — delivered with a written results chapter.
HIV self-testing across Sub-Saharan Africa
Challenge: A large body of literature on HIV self-testing needed to be synthesised into a structured scoping review of delivery models, barriers and outcomes.
What I did: Supported the systematic literature search, screening and data charting, and the structured synthesis and write-up to journal standard.
Video-based learning in surgical training
Challenge: A study on video-based surgical learning combined quantitative survey data with qualitative responses and needed a rigorous mixed-methods analysis and write-up.
What I did: Analysed the quantitative measures, supported the qualitative thematic synthesis, integrated both strands, and prepared the results and figures to journal standard.
The analyses I deliver
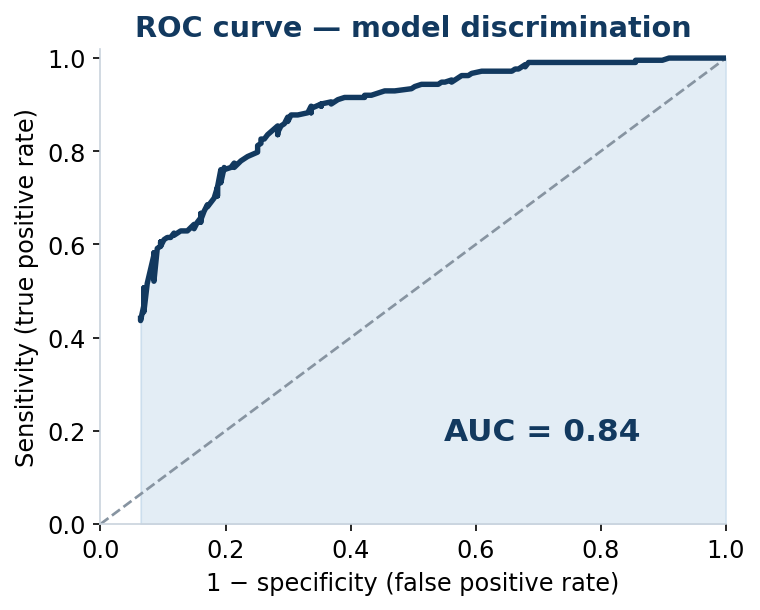
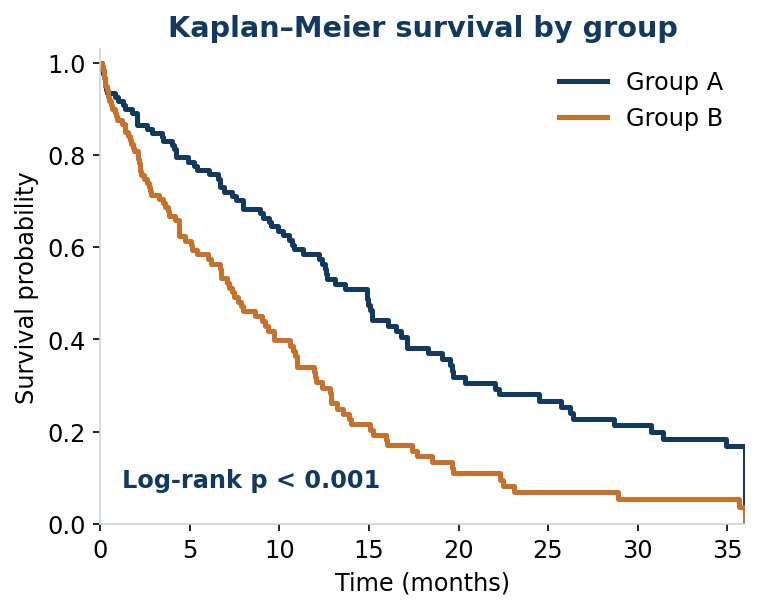
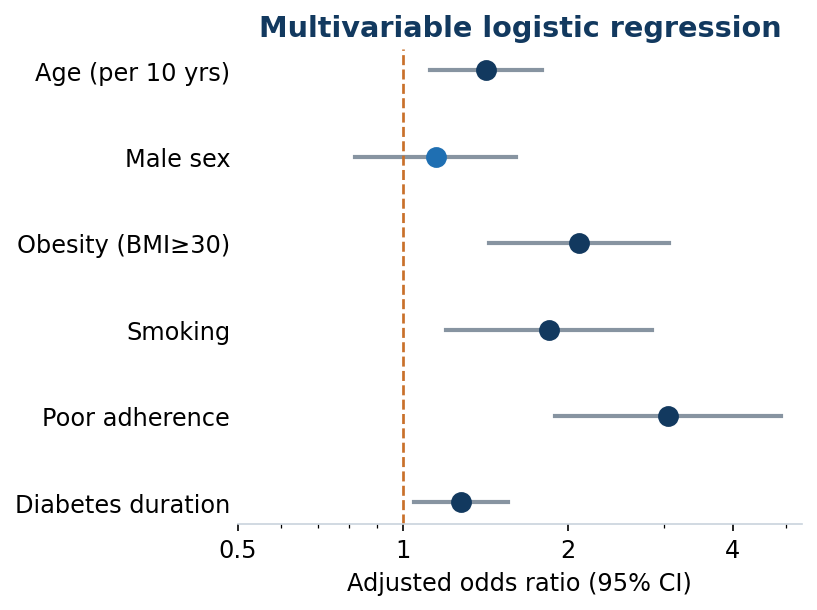
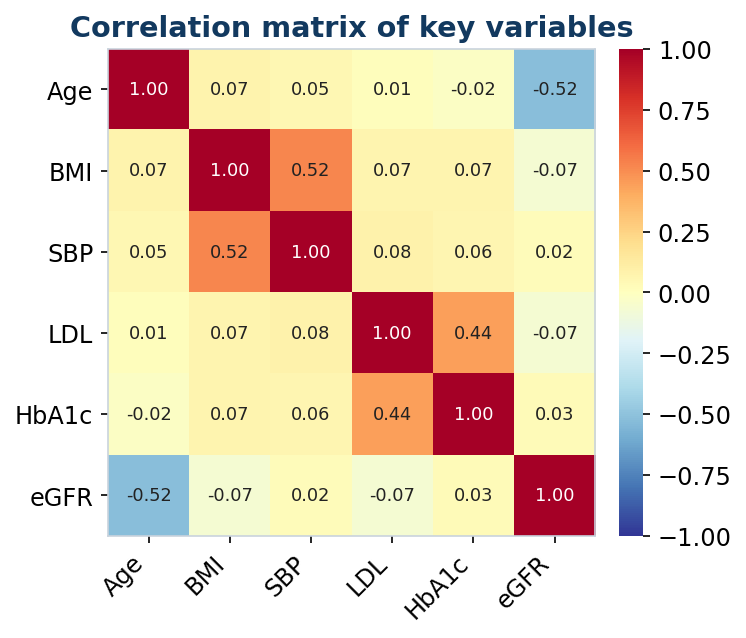
From simple group comparisons to survival models and predictive analytics — all publication-ready and explained in plain language. The figures below are illustrative examples of the outputs you receive.
ROC threshold explorer
Move the decision cut-point and watch sensitivity and specificity trade off in real time — the heart of any diagnostic or predictive model.
Area under the curve (AUC) = · illustrative binormal model.
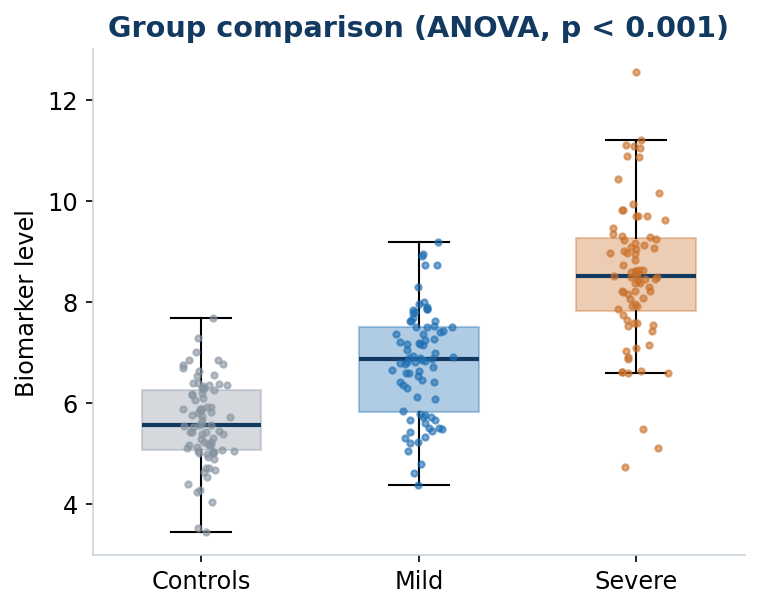
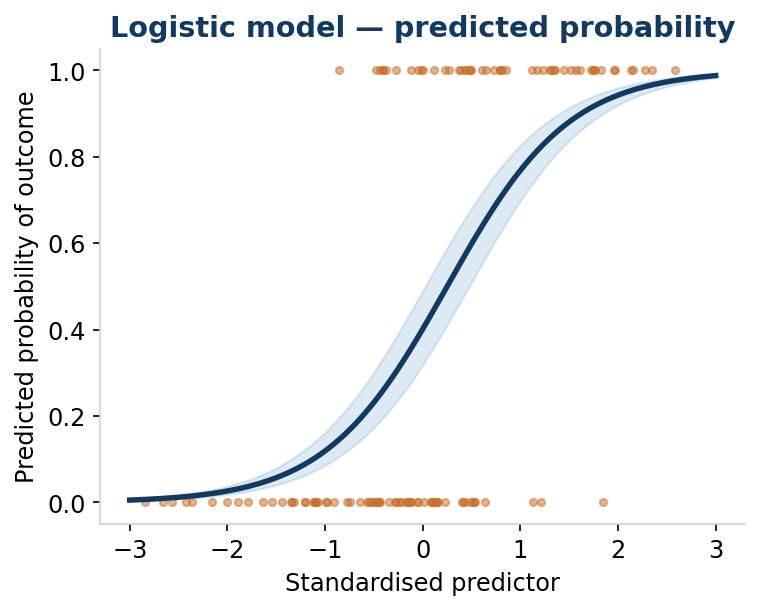
Also available: propensity-score matching, mixed-effects & multilevel models, meta-analysis, diagnostic-test evaluation, and sample-size / power calculations. Discuss your analysis →
Sample-size calculator
Planning a study that compares two groups? Get an instant estimate of the sample size you'll need. Indicative two-proportion calculation — for your exact design, book a free consult.
Trusted by clinicians and researchers
Feedback from doctors and researchers I've supported — across Nigeria and the UK.
Gabriel took the raw data from our respiratory studies and turned it into clean, publishable results — rigorous analysis, journal-ready figures, and papers that were accepted. He understands the clinical question, not just the statistics.
Department of Respiratory Medicine, UBTH
For our paediatric emergency research, his statistical analysis and clear results write-up made all the difference. Fast, meticulous, and always available to explain the numbers.
Department of Paediatrics, UBTH
Working with Kings Analytics on our public-health data was seamless — from study design and sample size to the final regression models and manuscript, delivered on time.
Department of Public Health, Igbinedion University
Dr. Ojeh-Oziegbe's biostatistics support was outstanding — thorough analysis and clear communication throughout. A genuine asset to any research project, whether in Nigeria or the UK.
Neonatal Unit, King's College Hospital NHS Foundation Trust (Princess Royal University Hospital), UK
Clear packages. Custom quotes.
Every project is quoted after a look at your data and requirements — these starting points give you a sense of scope. Prices in USD (primary); GBP for UK clients and naira for Nigeria available on request.
Starter Analysis
One dataset or research chapter
- Data cleaning & coding
- Descriptive & basic inferential stats
- Journal-formatted tables & charts
- Plain-language results summary
- 1 revision
Full Analysis
Complete statistics + results section
- Everything in Starter
- Multivariable regression modelling
- Results section written for you
- Journal-formatted figures & forest plots
- Reference formatting
- 2 revisions
Full Manuscript
Study to submission, done with you
- Study design & analysis plan
- Full analysis + complete manuscript
- Journal formatting & cover letter
- Submission support
- Point-by-point reviewer responses
- Support until acceptance
Advanced work — systematic reviews & meta-analyses, survival or multilevel modelling, grant statistical analysis plans, or a monthly retainer for research teams — from $2,500. Final price is always confirmed after seeing your data. Every engagement includes confidentiality and secure handling of your data.
Prefer to do it yourself? Get the guides.
The Researcher's Complete Package — step-by-step guides that walk you through analysing your data and writing every chapter of your thesis or paper. Instant download on Gumroad.
The Researcher's Complete Package — All 4 Volumes
Every guide bundled: manuscript writing, the full thesis (Chapters 1–5), tables & figures, and statistics selection with SPSS. The complete system, start to finish.
Detailed Manuscript Writing
How to structure and write a complete, submission-ready manuscript section by section.
Complete Thesis Writing Guide (Ch 1–5)
A chapter-by-chapter walkthrough of the entire thesis, from introduction to conclusion.
Tables, Figures & Data Visualisation
Build clear, journal-standard tables and figures that present your results with impact.
Statistics Selection & SPSS Guide
Choose the right statistical test for your study and run it correctly in SPSS.
Guides are for researchers who want to learn and do it themselves. Want it done for you instead? See the done-for-you packages or book a free consult.
Ojeh-Oziegbe
MBBS · Physician-biostatistician
A doctor who speaks statistics — and journals.
I'm a practising medical doctor with a special interest in radiology and radiation oncology, and years of clinical data-analysis experience. Through Kings Analytics I've been the primary statistical analyst on 100+ external research projects, and I've authored over 25 peer-reviewed papers in international journals. I also review manuscripts for multiple medical journals — including The Neuroradiology Journal — so I read your work the way a reviewer will, and fix the problems before they do.
- MBBS, University of Benin · licensed by the Medical & Dental Council of Nigeria (MDCN)
- Lead Biostatistician & Research Consultant, Kings Analytics — 100+ projects
- Over 25 peer-reviewed publications (2022–2026) across multiple specialties
- Peer reviewer for multiple international medical journals
- GCP (Good Clinical Practice, NIDA Clinical Trials Network) certified
- Google Data Analytics Professional Certificate · “Writing in the Sciences” (Stanford)
- NPMCN Primary Exam in Radiology · SPSS, R, Stata, REDCap, SQL, Excel
Frequently asked questions
Everything you need to know before booking a consult. Have another question? Just ask.
Primarily SPSS, R and Stata, plus REDCap for data capture and Excel for data handling. If your school or journal requires a specific package, I'll work in it. Just tell me your preference in the intake form.
Yes. Beyond running the analysis, I write clear, journal-ready methods and results sections, prepare the tables and figures, and can support the discussion. You remain the author — I provide the statistical and writing support so your paper reads as it should.
Every engagement is confidential. Your data is used only for your project, stored securely, and never shared. Client and participant details are never disclosed — the case studies on this page are deliberately anonymised. A written confidentiality agreement is available on request.
It depends on the scope and the state of your data, but a typical analysis with a written results section runs one to two weeks. Working to a submission or defence deadline? Tell me the date — express turnaround is available for time-critical projects.
Yes. Revisions are included in every package, and I prepare point-by-point responses to reviewers and re-run or extend analyses as journals request — I stay with your manuscript through the review process.
No honest consultant can guarantee acceptance — the editorial decision rests with the journal. What I do guarantee is rigorous, defensible analysis and clear writing that gives your work the best possible chance, and I support you through revisions until a decision is reached.
After a free consult you receive a fixed quote. Payment is split 50% to start and 50% on delivery. Prices are in USD (primary); GBP for UK clients and naira for Nigerian clients can be arranged.
Absolutely — and it's the best time to involve a statistician. I help define research questions and objectives, calculate sample size, choose the right design, and write a statistical analysis plan so your study is sound before you collect a single data point.
Tell me about your project
Send the details below or book a free 30-minute consult. I reply within 24 hours with next steps and, where possible, an initial scope.
Thank you — your enquiry is in.
I've received your project details and will reply within 24 hours with next steps. For anything urgent, message me on WhatsApp.
Book a free 30-min consult
Pick a time that suits your timezone — no obligation, just a conversation about your data and how I can help.
Open my booking calendar ↗Calendar not loading? Use the button above, or request a time via WhatsApp.
-
WhatsApp
+234 912 981 7652 -
LinkedIn
Dr. Ojeh-Oziegbe -
Based in Edo, Nigeria
Working remotely worldwide
Let's get your manuscript moving.
Tell me about your data and your deadline. The first 30-minute consult is free, and you'll get a clear scope and quote before any work begins.